Anthropic 43.8% vs. OpenAI 39.8%: What Enterprise Adoption Really Shows

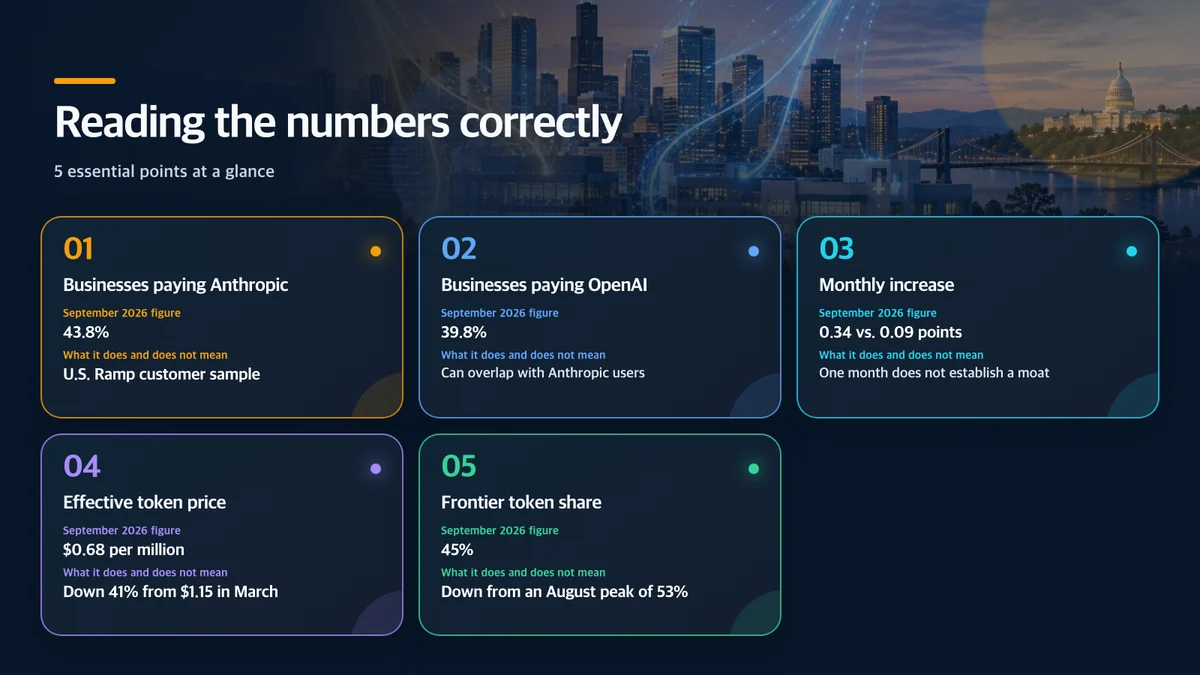
Anthropic payments appeared at 43.8% of businesses in the September 2026 Ramp AI Index, compared with 39.8% for OpenAI. The headline “Anthropic moves ahead” is accurate inside this dataset. “Anthropic now owns more of the global AI market” is not.
Ramp measures observed payments among U.S. businesses using its corporate cards and spend-management platform. A company can buy Claude and OpenAI APIs at the same time, and a count of paying companies is not revenue, token volume or employee engagement. The data is still useful because it shows how quickly businesses switch and combine providers—and how price competition is changing what they buy.
Three takeaways
- Anthropic led OpenAI by 4.0 percentage points in Ramp’s business-adoption measure, 43.8% to 39.8%.
- Effective token prices fell 41%, from $1.15 per million tokens in March to $0.68, while frontier-model token share declined from 53% to 45%.
- Businesses increasingly combine vendors and route routine work to lower-cost standard models instead of choosing one universal winner.
Reading the numbers correctly
Why Anthropic may be gaining faster
Ramp’s data cannot isolate one cause. The 2026 enterprise market has emphasized coding agents, long-document workflows and professional knowledge work, areas where Anthropic has concentrated Claude Code and its Opus and Fable models. Ramp’s vendor profile also shows continued growth in the number of businesses paying Anthropic.
OpenAI’s 39.8% does not represent contraction. Its measure increased 0.09 percentage point during the month; Anthropic simply grew faster at 0.34 point. Buyers can also purchase ChatGPT seats, APIs, Codex and multimodal services through different channels, some of which may not appear under a single direct vendor label in transaction data.

Why 43.8 plus 39.8 is not market share
These are not mutually exclusive slices. A company spending $20 with Anthropic and $20,000 with OpenAI can count once for each provider. A company accessing either model through a cloud platform may show a cloud vendor on the transaction instead of the underlying model company.
The metric answers a narrow question: what percentage of sampled businesses paid this provider? It does not answer what portion of generative-AI revenue a provider controls, which one processes more tokens or which product employees use more often.
That distinction reflects actual procurement. One organization may use Claude for coding, OpenAI for general workflows and images, and a third model embedded in its cloud data platform. Multi-vendor purchasing is becoming a default pattern for resilience and workload economics.
The bigger signal: effective token prices fell 41%
Ramp estimates that the effective price businesses paid fell from $1.15 per million tokens in March to $0.68 in September, a 41% drop. This is not the posted price of a single flagship model. It reflects the mix of models and purchasing choices companies actually made.
Frontier models accounted for 53% of observed token volume at their August peak, then fell to 45%. That suggests companies are setting cheaper standard models as the default and escalating only hard requests. Provider price cuts, caching, batch processing and improving smaller models reinforce the shift.

Lower unit cost does not guarantee a smaller AI budget. If cost per task falls 41% while task volume doubles, total spend still rises. Agents can also call tools and retry several times for one user-visible result. Buyers should track cost per completed, accepted business outcome—not only dollars per token.
Adoption is not revenue or usage
An adoption count gives a tiny pilot and a companywide deployment equal weight as one business. Revenue does the opposite. Token usage adds another layer because input, output, cache, image and voice workloads have different economics.
The 43.8% figure therefore does not establish that Anthropic has more revenue or compute volume than OpenAI. Monthly rankings can also move quickly after a model launch, annual contract renewal, security approval, price cut or outage. A four-point lead shows current purchasing momentum, not an enduring barrier to competition.
What U.S. procurement teams should do
The Ramp sample is directly relevant to U.S. businesses, but it still should not replace an internal evaluation. A model that wins a coding benchmark may lose on a company’s customer-support tone, regulated-document extraction or connected-app reliability.
Procurement should preserve portability. Keep test cases, structured-output schemas and tool contracts independent of one provider where possible. Define data classes that each provider may receive, log retention rules, deletion workflows and a tested failover route. Multi-vendor adoption without common governance can multiply risk instead of reducing it.
The financial comparison should include subscription seats, API usage, caches, retries, evaluation, staff review and delay. A more expensive model can be cheaper per completed task if it avoids enough rework. A low token price can be expensive if the workflow fails often.
Five questions for enterprise buyers
- Completion rate: What share of tasks pass review, not merely return a response?
- Total cost: What do API charges, seats, retries, cache and human review add up to?
- Portability: Can prompts, tests and tools move to another provider?
- Data terms: What are the retention, training-use, region, deletion and audit rules?
- Routing: Which standard model handles routine work, and what evidence triggers escalation?
Frequently asked questions
Does this make Anthropic the global market leader?
No. It makes Anthropic the leader in this payment-adoption metric among U.S. companies using Ramp. It is not global revenue, user or token share.
Is OpenAI adoption shrinking?
No. OpenAI’s measure increased 0.09 percentage point that month. Anthropic grew faster at 0.34 point.
Should a company choose only one provider?
Not necessarily. The metric itself allows overlapping adoption. Multiple providers require shared controls for data, evaluation, access and incident response.
Bottom line
The 43.8% to 39.8% result is a meaningful signal of Anthropic’s enterprise momentum, not proof of a permanent or global market-share reversal. The more structural finding is that effective token costs fell 41% while businesses reduced their frontier-model mix.
Competition is shifting from “which single model wins?” to “which routed portfolio completes each workload most reliably and cheaply?” Procurement teams should measure accepted outcomes, total cost, data control and switching ability—not a monthly leaderboard alone.
Sources and rights notice
Ramp, Anthropic, Claude, OpenAI and related names and marks belong to their respective owners. This independent editorial analysis is not sponsored, endorsed or approved by those companies. It states the sample boundaries and overlapping-adoption caveat rather than presenting the result as global market share. Its images are editorial concepts, not actual companies or product screens.