Google WeatherNext 3 Explained: Hourly AI Forecasts at Up to 5km Resolution
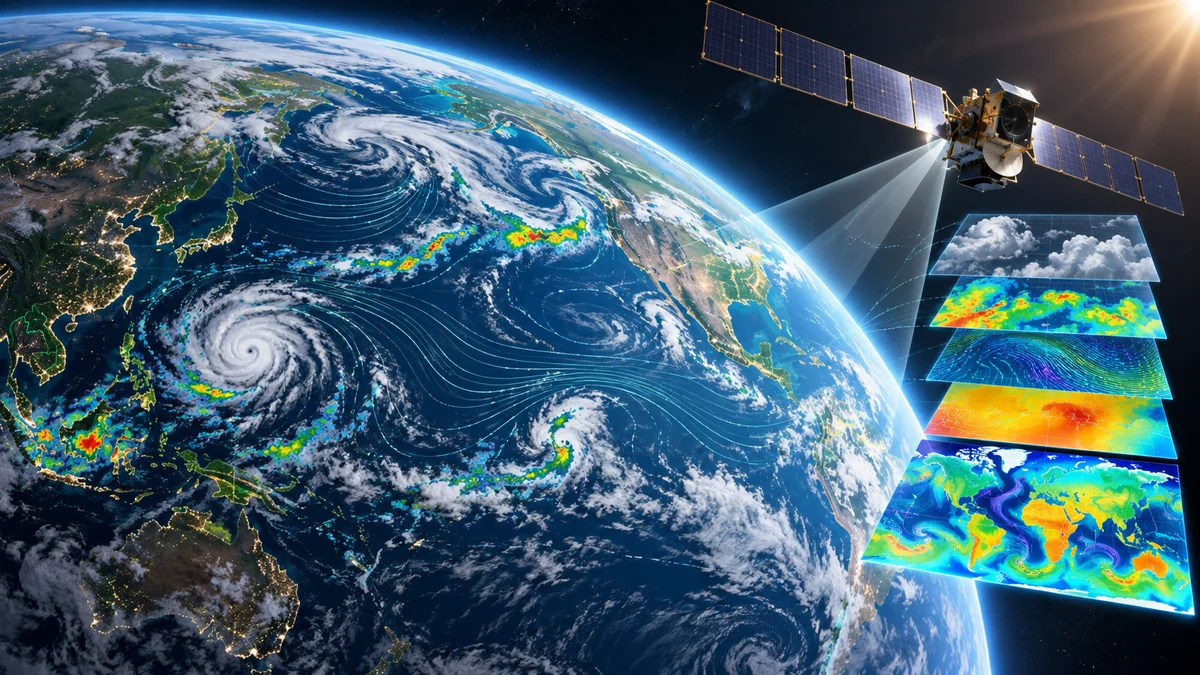
Google DeepMind and Google Research’s WeatherNext 3 changes both the input and refresh cycle of a global AI weather model. It incorporates live geostationary satellite mosaics with traditional analysis and observations, then produces a new forecast every hour. Some surface temperature and moisture variables are available at 5-kilometer resolution, other surface variables at 10 kilometers, and atmospheric variables at 25 kilometers.
Google describes the overall forecast picture as roughly five times sharper than WeatherNext 2, which used a 25-kilometer grid and six-hour intervals. That does not mean every variable is delivered at 5 kilometers, nor does a finer grid guarantee the exact start time of rain on every block. Resolution, refresh rate, and forecast accuracy are related but different properties.
Three things to know
- The main advance is a live satellite-informed forecast that refreshes hourly and represents local terrain more finely.
- The model adds 100-meter wind speed, cloud cover, and solar-radiation variables for wind and solar planning.
- Google weather experiences can become more useful without becoming official emergency-warning systems. National Weather Service watches, warnings, and local emergency instructions remain authoritative.
What changed from WeatherNext 2
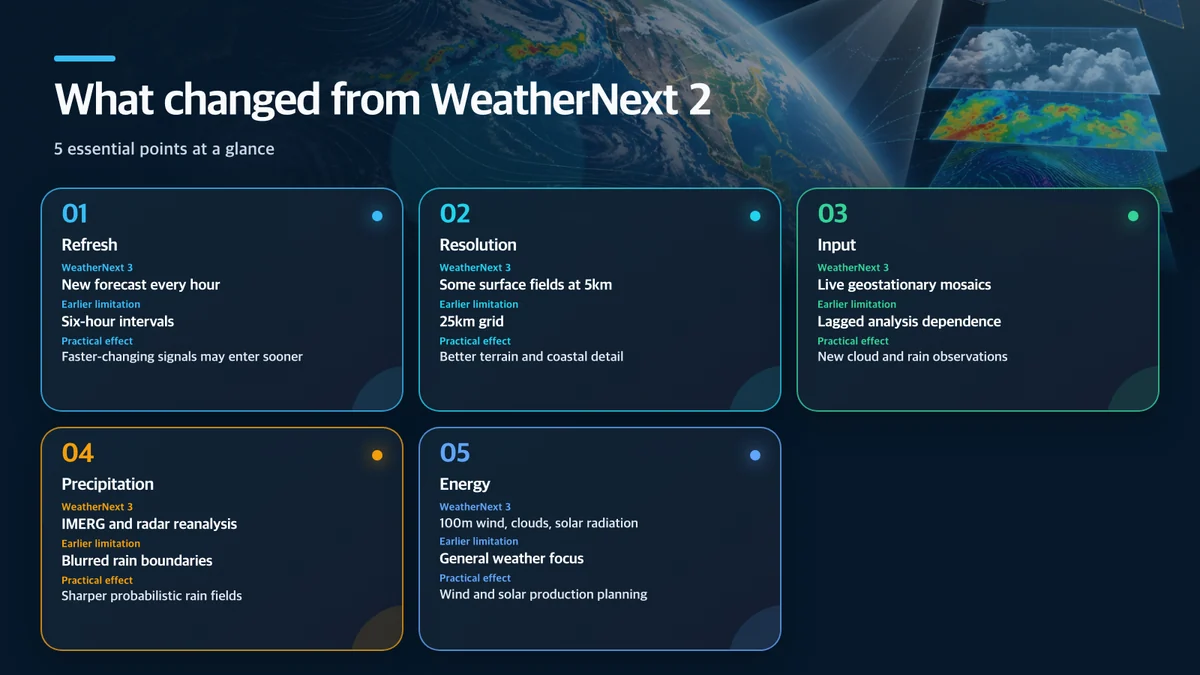
The Google WeatherNext 3 announcement says selected temperature and moisture fields are generated at 5 kilometers, other surface variables at 10 kilometers, and atmospheric fields such as winds at 25 kilometers. The system is intended to keep broad circulation and finer topography physically consistent across those scales.
Why live satellite input matters
Many AI weather models have been trained and initialized from analysis or reanalysis produced by numerical weather-prediction systems. Those datasets are rich and physically structured, but processing can introduce latency. Fast-developing precipitation, clouds, and surface temperature benefit from the newest observations available.
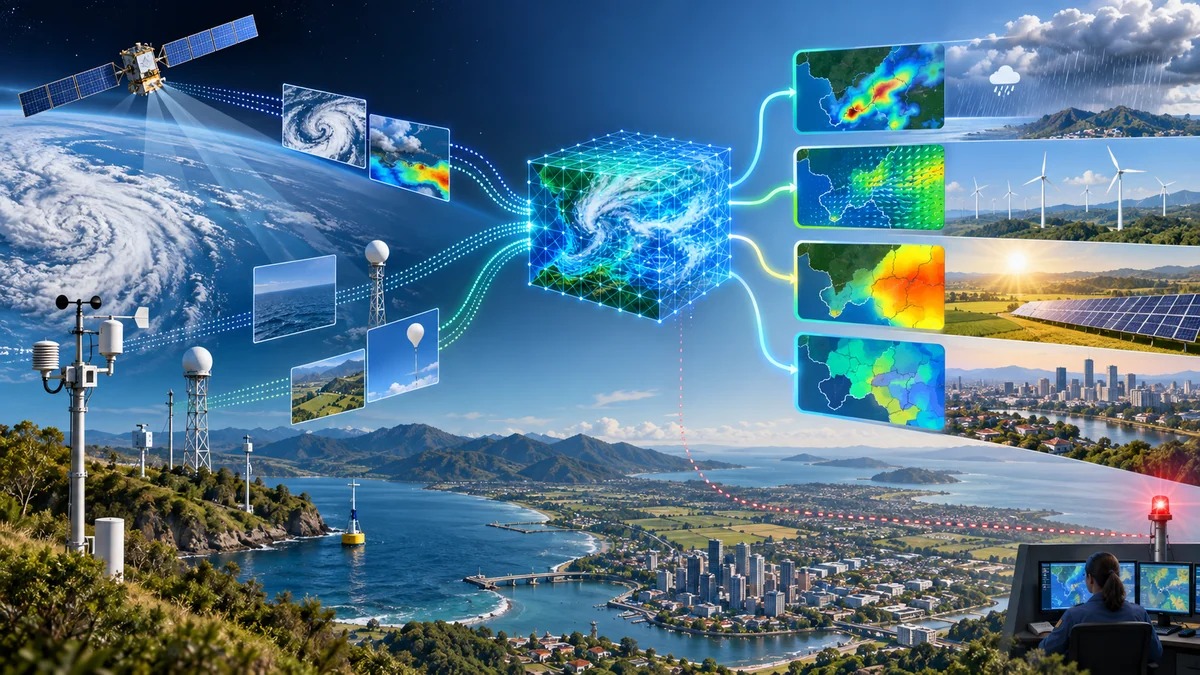
WeatherNext 3 ingests hourly global mosaics from geostationary satellites, combines them with established analysis and station observations, and updates the forecast. The approach may be especially useful near coastlines, mountains, valleys, and urban areas where conditions can vary over relatively short distances.
Satellites still do not observe every near-surface process directly. Mountain precipitation, boundary-layer winds, conditions under thick clouds, and station coverage remain sources of uncertainty. A 5-kilometer grid is also not a direct measurement of weather at one home, school, or stadium.
How to interpret the precipitation claims
Google says it trained the precipitation component with NASA’s IMERG satellite precipitation data and its own satellite-radar global reanalysis. The company reports medium-range CRPS improvements of up to 60% against IMERG, 30% against U.S. MRMS, and 10% against rain gauges at early lead times.
For consumer products, Google says precipitation forecasts a day or more ahead can be up to 50% more accurate, with the largest benefits in historically underserved regions. “Up to” is a ceiling under particular regions, lead times, variables, and evaluation methods. It is not a promise of a 50% improvement for every U.S. location or storm.
Accuracy can also refer to different outcomes: probability, amount, timing, or spatial placement. Consumers should not judge a global model from one rainy afternoon. Independent regional evaluation across seasons—and separate measurement of misses and false alarms for rare severe events—is more informative.
Where users and developers will encounter it
WeatherNext 3 is being integrated into Google Search, the Gemini app, Google Maps, the Google Maps Platform Weather API, and Google Earth Engine. Researchers and businesses can query data through BigQuery and Earth Engine or obtain bulk data through Cloud Storage. Each product may expose different variables or adopt an update on a different schedule.
Consumers may notice better day-ahead planning for travel, outdoor events, and route conditions. Developers can use higher-resolution forecasts in logistics, agriculture, events, insurance, and energy applications. Receiving a better model field does not remove the application’s responsibility for location mapping, uncertainty display, fallback data, and clear alert language.
Renewable-energy implications
WeatherNext 3 includes wind speed at 100 meters—roughly turbine hub height—along with higher-resolution cloud cover and surface solar radiation. Hourly updates can help grid operators and renewable developers revise expected production as conditions change.
Weather variables do not directly equal power output. Turbine power curves, panel orientation and soiling, equipment outages, transmission constraints, demand, and market rules remain necessary. A percentage improvement in a weather score should not be translated into the same percentage of energy output or cost savings without a validated operational model.
How to use it safely in the United States
Google’s forecast can be useful for routine planning and for adding context to a decision. During hurricanes, severe thunderstorms, floods, heat emergencies, winter storms, or wildfire weather, users should follow National Weather Service watches and warnings, local emergency management, and evacuation orders. A consumer forecast card is not a substitute for an official alert.
Organizations integrating WeatherNext data should validate:
- spatial and temporal resolution for each variable
- data latency and behavior when an update is missing
- seasonal and regional bias across their service area
- how probabilities are presented without false certainty
- clear separation between product guidance and official warnings
- API, BigQuery, storage costs, and licensing terms
- human review for decisions affecting safety or critical infrastructure
WeatherNext 3 does not mean AI has solved weather. It creates a faster and more detailed global forecast foundation that can reach consumer and developer products at scale. Its best use is as an additional planning signal, paired with official warnings, local observations, and domain-specific judgment.
Sources and use notice
Resolution and accuracy figures are Google-reported results and require independent regional validation. NASA IMERG is named only to identify a training dataset. This article does not reproduce official charts, satellite images, product interfaces, or logos, and its editorial visuals are not presented as National Weather Service products.