A Very Strong El Niño Is Building: What the 2026–27 U.S. Winter Outlook Says
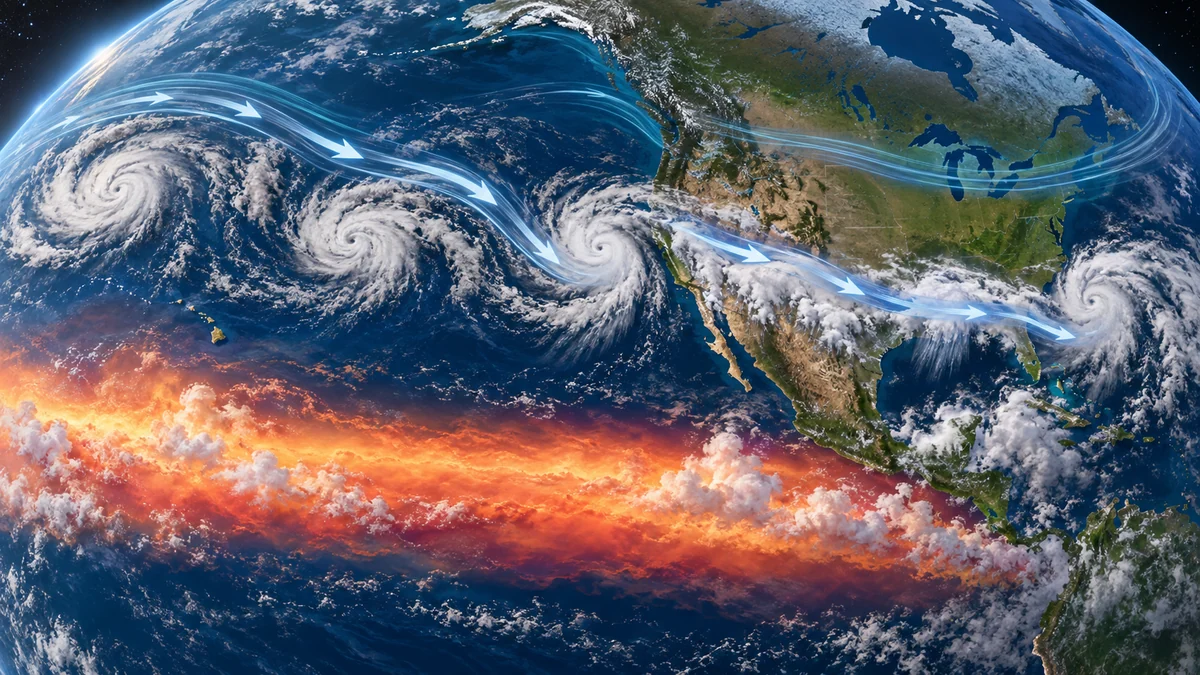
The tropical Pacific is no longer sending a subtle signal. In its September 10 diagnostic discussion, the NOAA Climate Prediction Center said El Niño was strengthening and put the chance of a very strong event during fall and winter 2026–27 above 90%. For October through December, NOAA assigned a 75% chance that its tropical-adjusted index would reach a level beyond previous El Niño events in the record dating to 1950.
That is a consequential forecast, but it is not a promise that every familiar El Niño impact will occur. El Niño is not a storm that arrives on a particular date. It is a coupled change in the tropical Pacific Ocean and atmosphere that shifts the odds of certain jet-stream, temperature and precipitation patterns. Local weather still depends on shorter-term atmospheric circulation, terrain and other climate patterns.
The useful conclusion is therefore more precise: a very strong El Niño makes a wet southern storm track and a relatively mild northern tier more likely, but it does not guarantee rain, snow or temperature outcomes for any one city. The official seasonal maps and short-range forecasts still matter more than an El Niño label when a household, farm or utility makes a specific decision.
Three things to know
- The ocean and atmosphere are both displaying a strengthening El Niño, not just a temporary patch of warm water.
- NOAA sees a greater than 90% chance of a very strong event and a 75% chance of a record-level tropical-adjusted index in late 2026.
- The U.S. outlook favors a wetter southern corridor and relative warmth across much of the North, while important regional exceptions and uncertainty remain.
What turns warm Pacific water into El Niño
Scientists monitor sea-surface temperatures in a central equatorial Pacific region called Niño-3.4. They also look for an atmospheric response: weaker easterly trade winds, a change in surface pressure, and a shift in tropical clouds and rainfall toward the central and eastern Pacific.
That coupling is essential. The ocean provides an unusually large pool of heat, while the atmosphere reorganizes where air rises, where it sinks and how winds move across the basin. The change can then influence the Pacific jet stream and the average path of winter storms over North America.
According to the September NOAA analysis, the August Niño-3.4 anomaly was about 3.2°F. Parts of the eastern equatorial Pacific exceeded 5.4°F above average. Low-level winds, upper-level winds, convection and rainfall were also behaving consistently with a strengthening event.
Why NOAA calls the outlook potentially historic
NOAA’s newer Relative Oceanic Niño Index, or RONI, adjusts the temperature in Niño-3.4 relative to the tropical ocean as a whole. That distinction matters as the background climate warms. It helps separate an ENSO event from broad tropical warming.
For October through December 2026, NOAA gives a 75% chance that the three-month RONI will reach at least 4.5°F above its tropical-adjusted baseline. The agency describes that threshold as exceeding previous events in its record back to 1950. Its official assessment combines observations with several modeling systems rather than relying on a single model run.
“Historic” refers to the strength category of this climate index. It does not mean every U.S. region will experience record rain, record warmth or record snowfall. Stronger events generally raise confidence in the broad pattern, but the local outcome is never automatic.
What the latest U.S. outlook actually says
The September 17 long-lead outlook from the NOAA Climate Prediction Center covers temperature and precipitation probabilities rather than deterministic totals.
For October through December 2026, above-normal temperatures are favored across much of Alaska, most areas west of the Rockies, nearly all areas east of the Mississippi River and parts of the north-central states. The highest probabilities, above 50%, appear in Southeast Alaska, the northern Great Basin and around North Dakota and northwestern Minnesota.
The precipitation signal is concentrated farther south. Above-normal precipitation is favored from the southern half of California through much of the Four Corners and Great Plains, across the Mississippi and Tennessee valleys, through the Southeast and into the Mid-Atlantic. Parts of the eastern Gulf Coast and Southeast coast have probabilities above 60%.
The outlook modestly favors drier-than-normal conditions in parts of the interior Northwest and Great Lakes region. Where NOAA shows equal chances, the tools do not support putting one category—above, near or below normal—clearly ahead of the others. Equal chances do not mean average weather is guaranteed.
The winter pattern becomes clearer later in the season
From late fall into early spring, NOAA’s outlook increasingly resembles a classic El Niño pattern. Relative warmth is favored across many areas west of the Rockies and across northern and central parts of the country east of the Rockies. Probabilities of above-normal temperatures reach roughly 50% to 60% across portions of the interior Northwest and northern tier.
The dominant precipitation signal remains a wetter-than-normal southern and central United States. Near the California coast, the favored odds of above-normal precipitation rise to roughly 50% to 60% during the core winter and early spring outlook periods. Across the Gulf and Southeast coasts, probabilities reach as high as 70% to 80% in southern Georgia and northern Florida.
Those percentages describe the chance that a three-month total falls into the wettest of three historical categories. They do not predict that it will rain on 70% of days, and they do not specify how much rain a storm will produce.
Rain is not the same as snow
El Niño changes storm tracks, but snow requires cold air at the right place and time. A wetter seasonal signal can produce mountain snow, low-elevation rain or a mixture of both. A warmer seasonal average can reduce snow at lower elevations even while individual cold storms still create disruptive snowfall.
For California and the Southwest, water managers should watch both total precipitation and the fraction stored as mountain snowpack. A sequence of warm atmospheric-river events can increase runoff and flood risk without building the same spring water reserve as colder snow-producing storms.
Across the southern Plains and Southeast, a stronger subtropical jet can increase the opportunities for winter storms and heavy rain. It does not identify the track or severity of any individual event. Those details only become credible in shorter-range forecasts.
A negative PDO complicates the textbook pattern
The 2026 setup differs from the three strongest historical El Niño events that forecasters often compare—1982–83, 1997–98 and 2015–16. NOAA notes that those events occurred with a positive Pacific Decadal Oscillation, while the August 2026 PDO index was negative at −1.11.
The PDO describes a longer-lived pattern of North Pacific sea-surface temperature and atmospheric variability. A negative phase may damp some textbook El Niño effects in particular regions. NOAA also identifies an unusual placement of warm water in the Gulf of Alaska as another reason not to copy a past winter and treat it as a forecast for 2026–27.
This is an important safeguard against analog storytelling. Historical events can explain mechanisms, but the ocean background, sea ice, long-term warming and other circulation patterns are not identical from one episode to the next.
What households and businesses should watch
California and the Southwest
Track precipitation probabilities, reservoir conditions, soil saturation and snow levels separately. A wet seasonal forecast does not remove drought risk everywhere, and it can coexist with flash-flood or debris-flow risk after wildfires.
The Gulf Coast and Southeast
Prepare for a higher chance of a wet storm track while relying on local National Weather Service forecasts for individual flood, wind or severe-weather episodes. Seasonal probabilities cannot provide neighborhood-level timing.
The northern tier
A mild seasonal tilt can reduce total heating demand, but it does not eliminate Arctic outbreaks. Utilities and households still need capacity for brief periods of extreme cold even when the three-month average finishes above normal.
Agriculture and transportation
Farm impacts depend on crop calendars, field drainage, freeze timing and disease pressure rather than on the El Niño label alone. Transportation planners should distinguish persistent seasonal wetness from specific snow, ice, fog and flood hazards that emerge days in advance.
What this forecast does not mean
- It does not mean every southern state will be wetter than average.
- It does not mean every northern state will have a warm, snow-free winter.
- It does not prove that an individual storm was caused by El Niño.
- It does not convert a 70% seasonal probability into 70% more rain.
- It does not replace monthly updates, local forecasts or emergency alerts.
NOAA’s El Niño FAQ describes these relationships as changes in probability, not guarantees. Depending on location and event strength, a commonly associated impact may appear often, occasionally or not at all.
The update schedule matters
NOAA issues its ENSO diagnostic discussion on the second Thursday of each month. The next update is scheduled for October 8, 2026. Seasonal U.S. outlooks are also updated monthly, and their regional probabilities can change as the ocean, atmosphere and forecast models evolve.
The best way to follow the winter is to use a ladder of forecasts:
- ENSO updates describe the global background state.
- Seasonal outlooks show regional shifts in temperature and precipitation odds.
- Monthly and two-week outlooks narrow the time window.
- Local forecasts and warnings guide decisions for a specific storm.
No single rung can do the work of all the others.
Bottom line
The evidence for a powerful 2026 El Niño is unusually strong. Ocean temperatures, tropical winds and rainfall patterns are moving together, and NOAA gives a greater than 90% chance that the event will be very strong during fall and winter. Its U.S. outlook favors a wetter southern storm corridor and relative warmth across much of the northern tier.
The forecast should change preparation, not encourage certainty. California needs to track rain, runoff and snow level together. The Gulf and Southeast should prepare for a greater chance of a wet winter pattern. Northern regions should plan for lower average heating demand without assuming that short cold outbreaks are gone.
The most useful question is not “Will El Niño hit my city?” It is which seasonal risks have become more likely, and what do the next official outlooks say about their location and timing?
Sources and usage notice
- NOAA Climate Prediction Center, September 2026 ENSO Diagnostic Discussion
- NOAA Climate Prediction Center, U.S. Long-Lead Seasonal Outlook Discussion
- NOAA Climate.gov, El Niño and La Niña Frequently Asked Questions
- NOAA Climate Prediction Center, Official RONI Strength Probabilities
- Korea Meteorological Administration, El Niño and La Niña Outlook
This article independently explains the observations and probability outlooks published by the agencies above. It does not reproduce their photographs, maps, charts or diagrams.