South Korea’s AI Adoption Reaches 40.6%: How It Compares With the U.S.

South Korea’s estimated generative AI adoption reached 40.6% in the second quarter of 2026. The United States reached 33.0%, while the global estimate was 18.8%. Korea gained 3.5 percentage points in one quarter, again the largest absolute increase among major economies, and moved from 16th to 12th place.
Those figures do not come from a survey that directly asked 40.6% of Koreans about their habits. The Microsoft Q2 2026 Global AI Diffusion release estimates the share of people ages 15 to 64 who used a generative AI product during the reporting period. It uses aggregated, anonymized telemetry and adjusts for differences in devices, operating systems, internet access and population.
The careful conclusion contains two parts. South Korea’s breadth and pace of adoption are clearly ahead of the U.S. in this dataset. But 40.6% is not a measure of daily use, skill, productivity or satisfaction.
Three things to know
- South Korea increased from 37.1% in Q1 to 40.6% in Q2, a gain of 3.5 percentage points.
- The U.S. rose from 31.3% to 33.0%, while the world moved from 17.8% to 18.8%.
- The index estimates whether someone used a generative AI product, not how often or how well the tool was used.
The Q2 comparison
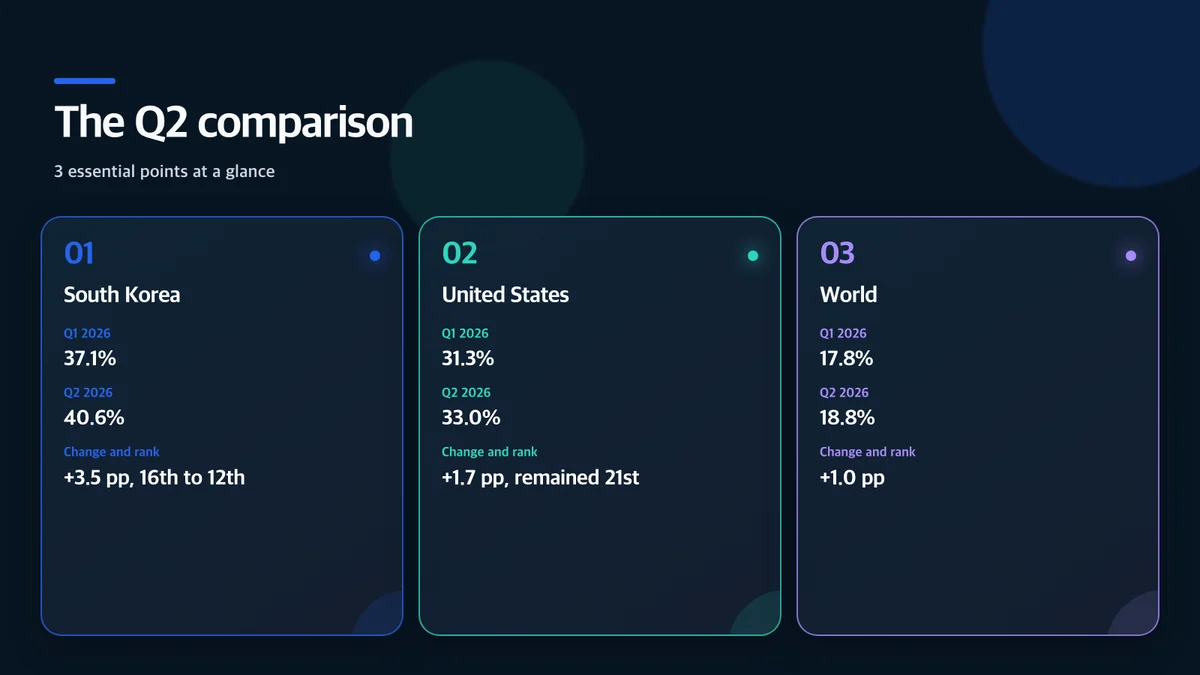
Both countries grew, but Korea’s quarterly increase was about twice the U.S. increase and 3.5 times the global gain. Microsoft says Korea has posted the largest increase among major economies for three consecutive reporting periods and gained nearly 15 percentage points over the past year.
The 40.6% figure does not mean that four in ten working-age Koreans use AI every day. A person who tried a covered product once during the period may be counted alongside a person who depends on it for daily work.
How the estimate is built

The Microsoft AI Economy Institute starts with aggregated, anonymized activity signals from widely used generative AI services. It then normalizes each country estimate for the local mix of devices and operating systems, the level of internet access and population. The resulting “AI User Share” is intended to support fairer cross-country comparisons than an unadjusted user count from any single service.
The method can track a fast-changing technology on a shorter cycle than a new large survey. It applies a common framework across 147 economies. The public Microsoft AI Diffusion data repository shows the sequence for South Korea at 25.9%, 30.7%, 37.1% and 40.6%; the U.S. sequence is 26.3%, 28.3%, 31.3% and 33.0%.
Telemetry also creates a boundary around what can be observed. Statistical adjustments do not capture every new product, private enterprise system, offline model or unmeasured device. Estimates can be revised as the product list and method evolve.
Why might Korea be growing faster?
The report does not establish one causal explanation for Korea’s gain. The following factors are plausible context, not a measured decomposition of the 3.5-point increase.
Dense consumer access
High smartphone use and fast broadband reduce the effort required to try a new service. Web and mobile products can spread quickly without a new device purchase. Access, however, does not prove deep or productive use.
Stronger Korean-language support
As global and domestic models improve Korean text, speech and document handling, the language barrier falls. Integration into search, messaging, office, education and creative products creates more entry points.
Fast experimentation in school and work
Students and employees can try summarization, translation, drafting, coding and research assistance. This kind of experimentation can increase the measured reach even when many users are still deciding whether AI deserves a permanent place in their workflow.
Intense public attention
Frequent product releases and debate about automation encourage nonusers to experiment. Public attention can accelerate initial reach, while retention later depends on cost, reliability and practical value.
What the U.S.–Korea gap does not prove

The U.S. estimate being lower does not show that the American AI industry or American businesses trail Korea. The index does not measure investment, frontier-model capability, company revenue, enterprise deployment or worker productivity. It estimates population-level breadth of use.
The United States is geographically and economically large, with substantial differences among states, metropolitan areas and rural communities. Korea’s population and network infrastructure are more concentrated. A national percentage hides those internal distributions.
The report’s separate analysis of use cases compares a subset of Copilot conversations in the Global North and Global South. It is not a country-by-country comparison of Korea and the United States. Its findings about learning, shopping or content creation should not be relabeled as unique national behavior.
Six things the statistic cannot tell us
- Frequency: It does not separate one-time trials from daily dependence.
- Outcome: It does not measure time saved, quality gained or errors introduced.
- Every product: New tools and internal enterprise systems may be absent.
- A direct population survey: It is an adjusted telemetry estimate, not a census or poll.
- Safe use: It does not measure privacy, copyright review or factual verification.
- Cause: It does not isolate the effect of education, policy, connectivity or pricing.
What the U.S. should learn from the comparison
The gap suggests that consumer access and integration matter. Adoption can move faster when useful features are available in familiar devices and services. But maximizing a headline percentage should not become the policy goal.
The next questions are whether users can evaluate results, whether schools and employers set clear rules, whether small organizations can afford reliable tools, and whether benefits reach communities with weaker infrastructure. A higher adoption rate paired with more misinformation, hidden labor or privacy loss would not be unqualified progress.
Future reporting should be read alongside frequency surveys, workplace productivity studies, school-use data and breakdowns by age, income, occupation and location. Those sources measure dimensions the diffusion index intentionally leaves out.
Bottom line
South Korea’s 40.6% is a strong signal that generative AI has spread beyond early technology enthusiasts. Its quarterly gain and rank improvement exceed the U.S. and global pace in Microsoft’s data.
The number should not be converted into a claim that four in ten people are skilled daily users or that national productivity rose by the same amount. The more consequential phase begins after first use: depth, reliability, affordability and the distribution of benefits. Tracking the same measure over time while pairing it with independent surveys will provide a clearer picture than any single ranking.
Sources and usage notice
- Juan Lavista Ferres, Microsoft — Q2 2026 Global AI Diffusion release
- Microsoft AI Diffusion public data and documentation
- AI Diffusion technical paper
This article independently explains the published figures and analyzes their measurement limits. It does not reproduce source maps, charts, tables or photographs.